分享雅思考试小作文真题范文。每一篇范文都经由专业团队反复校对,最终外教审查定稿。成功就是日复一日那一点点小小努力的积累。
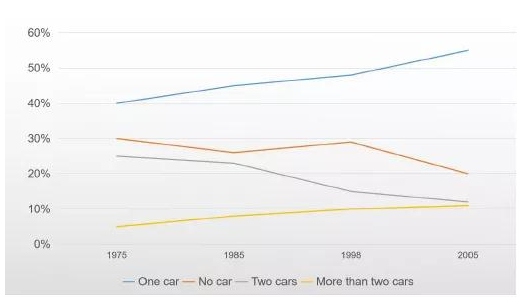
The graph below shows changes in percentage of households owning the car in the UK between 1975 and 2005.
Summarise the information by selecting and reporting the main features, and make comparisons where relevant.

教师示范
首先观察时间轴:完全在过往,确定时态
然后,写作的关键技巧:分组(原则有二:根据线的位置;根据线的趋势)。此图根据线的趋势分组:one car + more than two cars VERSUS no car + two cars。
The lines illustrate the changing percentages of the car ownership among the UK households over a 30-year period of 1975 to 2005. 接下来写图表的宏观(笼统的、趋势性的)情况: Overall, the period 时间为主语,后用“见证witnessed obvious changes in each of the four types of car ownership.
Having one car, the typical car ownership, 通过“同位语”的语法方式,把信息压缩到一个句子里了 and having multiple cars, the rare car ownership, 如法炮制,通过“同位语”的语法方式,把信息压缩到一个句子里了 both had a steady proportional growth. 于是读者就明白了写作者的分组 Meanwhile, one-car ownership, which increased from 40 percent to 55 percent, 通过“定语从句”的语法方式,把信息压缩到一个句子里了 grew faster than 介绍了两条线之间的关系 the other, whose increase was merely 6 percent. 如法炮制,通过“定语从句”的语法方式,把信息压缩到一个句子里了
主要关注 措辞:语法 和 词汇(表达程度的形容词)
Both of the other two types of car ownership, having no car and having two cars respectively, experienced an overall decrease. 先总写,再分写 Those households owning no car had a decreased proportion from 30 percent to 20 percent, despite the slight increase between 1985 and 1998. At lower levels, 介绍了两条线之间的关系 the proportion of two-car owners kept sliding from roughly 25 percent to half of the original level.
主要关注 文脉:总—分结构 和 描述线之间的关系
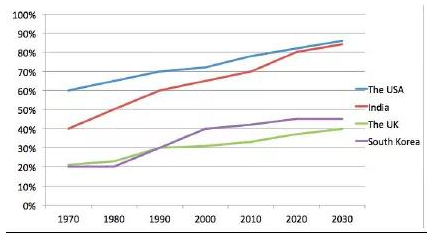
The graph below shows the percentages of people in cities in four different countries between 1970 and 2030.
Summarise the information by selecting and reporting the main features, and make comparisons where relevant.

首先观察时间轴:从过往到将来,确定时态
然后,写作的关键技巧:分组(原则有二:根据线的位置;根据线的趋势)。此图根据线的位置分组:the US + India VERSUS the UK + South Korea。
The lines illustrate four countries’ proportions of urban populationssince 1970 and the projections for the future until 2030. 接下来写图表的宏观(笼统的、趋势性的)情况: Overall, the increase since 1970, in all of the four countries, is likely to continue until 2030.
The US and India 地点为主语,后用“见证” have both seen/witnessedmassive growth since 1970. ß于是读者就明白了写作者的分组 Although India started at a lower level 介绍了两条线之间的关系 (40 percent), its increase has been faster than 介绍了两条线之间的关系 that of the US, which started at 60 percent, and with its urban population accounting for 80 percent, 通过“独立主格结构”作状语的语法方式,陈述了数值 India has almost caught up with the US. 如法炮制,通过“定语从句”的语法方式,把信息压缩到一个句子里了 In the future decade, the two countries’ urban populations are likely to both reach around 85 percent.
主要关注 文脉:不把线切成数段 而是 整体描述
There has been overall growth in the UK and South Korea, 通过“定语从句”的语法方式,把信息压缩到一个句子里了 which were once highly similar 通过状语从句的语法方式,陈述数值 as they both had a 20-to-30 increase. The two countries then started to follow different trends and to have different figures. 先总写,再分写 In South Korea, the figure has slowly increased at the above-40 level since a further surge, and that of the UK has gradually approached nearly 40 percent. The future decade, as the projection represents, will see stability in both countries.
主要关注 文脉:按照时间对应的线段来写(当然,也不要切成太多线段)